Principal Component Analysis is a very useful dimensionality reduction tool. It can really help you reduce the number of features of a model. Although it may seem a powerful tool for a data scientist, there are some drawbacks that I think make it unsuitable for supervised machine learning projects.
What is PCA?
Principal Component Analysis is a tool introduced by Karl Pearson (yes, “that” Karl Pearson). it is a procedure that makes a linear transformation of the features in order to get new features whose covariance matrix is diagonal.
The variance of a sum of random variables is:
\mathrm{Var}\left(\sum_i x_i\right) = \sum_i\mathrm{Var}(x_i) + \sum_{i\neq j}\mathrm{Cov}(x_i,x_j)If we assume that the covariance of a variable with itself is its variance, we can define the covariance matrix as:
\sigma_{ij} = \mathrm{Cov}(x_i,x_j)\qquad \textrm{with }\sigma_{ii} \equiv \mathrm{Var}(x_i)By performing PCA, the resulting new features in a rotated space don’t show any covariance with each other.
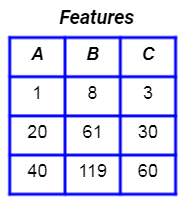
Let’s consider a set of features.
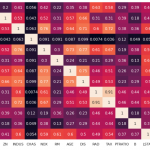
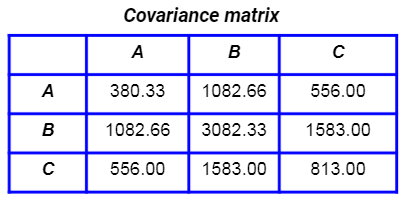
This is their covariance matrix:
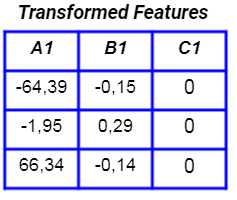
If we perform PCA, the new features are:
Their covariance matrix is now diagonal:
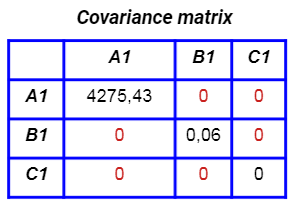
So, the features created by PCA are uncorrelated to each other. This is very useful when you have to work with a linear model, in which the correlation between the features can have a negative impact on the performance of the model. Generally speaking, even with non-linear models we can benefit from the PCA.
The most common approach with this tool is not only the removal of collinearity, but it’s the dimensionality reduction.
How to use PCA for dimensionality reduction
After we have created the new features, we can sort them from the one that carries more variance to the one that carries less variance. Then, we can select only those features whose cumulative variance exceeds some threshold (e.g. 90% of the total variance). More precisely, we’ll select the minimal set of features for which the cumulative variance exceeds such a threshold.
Let’s see an example in Python.
Let’s first import some libraries:
import matplotlib.pyplot as plt
import numpy as np
import pandas as pd

from sklearn.decomposition import PCA
from sklearn.datasets import load_diabetes
Let’s import our data, fit a PCA and then see the cumulative explained variance ratio.
X,y = load_diabetes(return_X_y = True)
pca = PCA()
pca.fit(X)
np.cumsum(pca.explained_variance_ratio_)
# array([0.40242142, 0.55165324, 0.67224947, 0.76779711, 0.83401567,
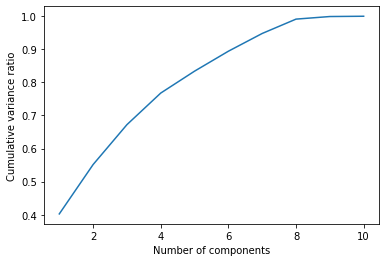
# 0.89428759, 0.94794364, 0.99131196, 0.99914395, 1. ])As we can see, if we want to keep 90% of the variance, we should take only the first 7 features. This way, we are reducing the number of the features, because we are neglecting those components that carry a small part of the total variance.
A general approach to selecting such a set of features is to look at a “knee” in the chart of the cumulative variance.
plt.plot(range(1,X.shape[1]+1),np.cumsum(pca.explained_variance_ratio_))
plt.xlabel("Number of components")
plt.ylabel("Cumulative variance ratio")
There’s a clear knee with 7 components, so that’s the number we should choose.
While this technique seems to be wonderful (it gives us a low number of uncorrelated features), it has some flaws that shouldn’t be allowed in a supervised machine learning model.
The flaws of PCA
First, the new features are a linear transformation of the original ones. So, we lose their meaning completely. The uncorrelated features don’t have any business meaning at all, so they aren’t explainable. We gain the removal of correlation, but we lose the ability to explain the model. This is a terrible result because, in a supervised machine learning model, we always have to explain what the model actually does and which features should be considered important.
Explaining and interpreting a model by looking at the importance of the features (using techniques like SHAP or by looking at the feature importance given by the model, if any), is a crucial task in a supervised machine learning project. PCA masks such importance by performing a linear transformation, so it’s not a good idea to use it.
Such linear transformation actually changes the meaning of the data, so it’s pretty difficult that a model could be able to learn from our dataset. Remember: a model extracts information from data. If we shuffle our data using PCA, information may become more difficult to extract. So, the model training is not improved, it’s compromised.
Finally, if you use a linear model and know that the features are correlated, PCA is a theoretical, lazy way to solve correlation. The correct approach is to perform proper exploratory data analysis and remove the collinear features that have no predictive power or use a proper library to deal with correlation. Don’t use PCA just to make a faster model. It simply doesn’t work.
Conclusion
PCA is a very powerful tool, but I suggest not to use it in supervised machine learning projects. It linearly combines the features and creates uncorrelated features, but it masks the information to the model and this is not a good approach for a successful training phase. Moreover, it masks the importance of the features, with the result that our model becomes less interpretable. If you need to reduce the dimensionality of the dataset, use proper feature selection techniques instead or use models that perform it automatically (like Lasso regression, for example).