
This post contains product affiliate links. We may receive a commission from Amazon if you make a purchase after clicking on one of these links. You will not incur any additional costs by clicking these links.

Feature selection has always been a great problem in machine learning. According to my experience, I can say it’s the most important part of a data science project, because it helps us reduce the dimensions of a dataset and remove the useless variables. Fortunately, there are some models that help us calculate the importance of the features, which helps us neglecting the less useful. Random forest is one such model.
What is a Random Forest?
Random Forest is a supervised model that implements both decision trees and bagging method. The idea is that the training dataset is resampled according to a procedure called “bootstrap”. Each sample contains a random subset of the original columns and is used to fit a decision tree. The number of models and the number of columns are hyperparameters to be optimized.
Finally, the predictions of the trees are mixed together calculating the mean value (for regression) or using soft voting (for classification).
The idea of bagging is that, by averaging the outputs of the single decision trees, the standard error decreases and so does the variance of the model according to bias-variance tradeoff. That’s why Random Forest has become very famous in the last years.
I nice, visual introduction to decision tree models and random forest can be found in this book.
How can Random Forest calculate feature importance?
Each tree of the random forest can calculate the importance of a feature according to its ability to increase the pureness of the leaves. It’s a topic related to how Classification And Regression Trees (CART) work. The higher the increment in leaves purity, the higher the importance of the feature. This is done for each tree, then is averaged among all the trees and, finally, normalized to 1. So, the sum of the importance scores calculated by a Random Forest is 1.
Feature selection using Recursive Feature Elimination
Once we have the importance of each feature, we perform feature selection using a procedure called Recursive Feature Elimination. In this article, I’ll talk about the version that makes use of the k-fold cross-validation.
The idea is to fit the model, then remove the less relevant feature and calculate the average value of some performance metric in CV. Then we remove the second last important feature, fit the model again and calculate the average performance. We keep doing this approach until there are no features left. The set of features that maximize the performance in CV is the set of features we have to work with. Please note that the entire procedure needs to work with the same values for the hyperparameters.
I really love this feature selection approach because it’s very powerful and useful. Again, you can get all the details by joining my online course.
Feature selection in Python using Random Forest
Now that the theory is clear, let’s apply it in Python using sklearn. For this example, I’ll use the Boston dataset, which is a regression dataset.
Let’s first import all the objects we need, that are our dataset, the Random Forest regressor and the object that will perform the RFE with CV. Finally, matplotlib for visualizing our results.
import numpy as np
from sklearn.datasets import load_boston
from sklearn.ensemble import RandomForestRegressor
from sklearn.model_selection import train_test_split
from sklearn.feature_selection import RFECV
import matplotlib.pyplot as plt
First, let’s load our dataset.
X,y = load_boston(return_X_y=True)
features = load_boston()['feature_names']
Now we can split it into training and test.
X_train, X_test, y_train, y_test = train_test_split( X, y, test_size=0.33, random_state=42)
Now we can fit our Random Forest regressor. In a real project, we must optimize the values of the hyperparameters. For this example, I’ll use the default values. I’ll only set the random state to make the results reproducible.
rf = RandomForestRegressor(random_state=0)

rf.fit(X_train,y_train)
Once the regressor is fitted, the importance of the features is stored inside the feature_importances_ property of the estimator instance.
Let’s, for example, draw a bar chart with the features sorted from the most important to the less important. We’ll have to create a list of tuples. The first element of the tuple is the feature name, the second element is the importance. Then we order our list for importance value and plot a horizontal bar plot.
f_i = list(zip(features,rf.feature_importances_))
f_i.sort(key = lambda x : x[1])
plt.barh([x[0] for x in f_i],[x[1] for x in f_i])

plt.show()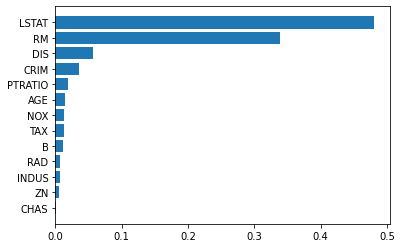
As we can see, LSTAT feature is the most important one, followed by RM, DIS and the other features. A horizontal bar plot is a very useful chart for representing feature importance.
Now, let’s use feature importance to select the best set of features according to RFE with Cross-Validation. For this example, the metric we try to optimize is the negative mean squared error. We’re going to work with 5 folds for the cross-validation, which is a quite good value.
rfe = RFECV(rf,cv=5,scoring="neg_mean_squared_error")

rfe.fit(X_train,y_train)
The complete set of features is:

The selected features are:
selected_features = np.array(features)[rfe.get_support()]
As we can see, RFE has neglected the less relevant feature (CHAS).
Conclusions
Random Forest is a very powerful model both for regression and classification. It can give its own interpretation of feature importance as well, which can be plotted and used for selecting the most informative set of features according, for example, to a Recursive Feature Elimination procedure. Properly used, feature importance can give us very good and easy-to-understand deliverables (the bar plot) and efficient optimization (feature selection). That’s why I think that feature importance is a necessary part of every machine learning project.


Good and to the point explanation. How to do this in R?
Thanks
Hello. Well, in R I actually don’t know, sorry.
Thank you for your efforts to make it look simpler
Mahamad
You’re welcome! I’m glad to help!
Thank you for effort. When I fit the model, I get this error. Do you have some fix to it? Thanks
ValueError: Found input variables with inconsistent numbers of samples: [339, 167]
Hello. This usually happens when X_train has a different number of records than y_train.
Hello, I appreciate the tutorial, thank you. I didn’t get why you split the data from both x and y into training and testing sets, yet you never used the testing set. Would using the whole dataset rather than only 66% of it be more interesting?
Hello, thanks for your comment. Feature selection must only be performed on the training dataset, otherwise you run the risk of data leakage. In this example I don’t use the test dataset because the goal of the article is to perform feature selection, so I stop with the training dataset.
What about situations in which the purpose of building the Random Forest estimator is only to identify a variable importance hierarchy, for use in building prediction models using a parametric modelling technique, such as (for example) a generalised linear model? In that scenario could it be valid to use the whole dataset as input to build the RF estimator?