Data scientists and analysts often have to work with mean values and need to compare the mean value of a sample with a known expected value or the mean value of another sample. Statistics helps us with a powerful set of hypothesis tests we can perform for such tasks.
The problem
Let’s say that we measure something like the height of Mount Everest. We know that it’s 8848 meters. After we measure it, we get 8840 meters with a standard error of 20 meters. Is our mean value statistically different from the known height?
Let’s say that another research group has performed the same measure with different tools and has obtained 8850 meters with a standard error equal to 10 meters. Is their result statistically different than ours?
These are two common problems when it comes to working with mean values. We often have to compare our mean value with a known expected value or with the mean value obtained by somebody else.
Comparing things with each other is a common problem in statistics and we can benefit from the theory of hypothesis tests in order to assess the statistical significance of such a comparison. In this article, I’m going to talk about the Student’s t-tests for the mean value. They are the most common types of hypothesis tests that can be performed and are very useful.
They all rely on a basic assumption: that the samples have been generated from a normal distribution.
Here follow some examples using Python programming language. All these examples are based on NumPy, so we first have to import it and set the seed of the random number generator. Let’s import matplotlib as well for histogram calculations.
import numpy as np

import matplotlib.pyplot as plt
np.random.seed(0)
Comparing the mean value with a known, expected value
The simplest form of a t-test is the one that compares the mean value of a sample with a known, expected value.
Let’s create a sample of 30 normally-distributed random numbers in Python using NumPy with a mean equal to 100 and standard deviation equal to 10.
x = np.random.normal(size=30,loc=100,scale=10)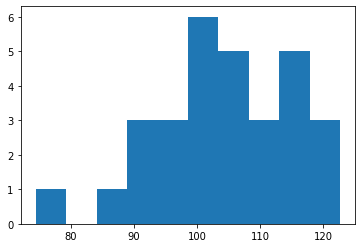
The mean value of this sample is 104.43. We’d like to tell whether it’s statistically different from 100.
The null hypothesis for such a t-test on the mean value is: the mean value is equal to 100. So, we are working with a 2-tailed test.
In order to use it, we have to import the proper function from Scipy.
from scipy.stats import ttest_1sampThen, we can use the “ttest_1samp” function, which gives us the p-value of such a 2-tailed test:
ttest_1samp(x,100)
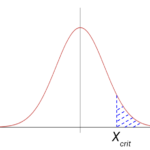
# Ttest_1sampResult(statistic=2.2044551627605693, pvalue=0.035580270712695275)If we wanted to use a 1 tailed test, the null hypothesis would be one of these:
- The mean value is greater than 100
- The mean value is less than 100
By stating the alternative hypothesis, we can calculate the p-values of these two tests.
# Null hypothesis: x.mean() is greater than 100
# (alternative hypothesis, it's less than 100)

ttest_1samp(x,100,alternative='less')
# Ttest_1sampResult(statistic=2.2044551627605693, pvalue=0.9822098646436523)
########################
# Null hypothesis: x.mean() is less than 100
# (alternative hypothesis, it's greater than 100)

ttest_1samp(x,100,alternative='greater')
# Ttest_1sampResult(statistic=2.2044551627605693, pvalue=0.017790135356347637)
This is an example of a Student’s t-test on a single sample. Remember that the sample must have been created from a normal distribution.
Comparing the mean values of two samples with the same variance
Let’s now create a new sample starting from the same normal distribution of the previous one. We can change the size from 30 to 50.
y = np.random.normal(size=50,loc=100,scale=10)Its mean value is 96.85.
Let’s say that we already know that the two samples come from two normal distributions with the same variance. We can use a 2-sample t-test to compare their mean values. We have to use the “ttest_ind” function.
from scipy.stats import ttest_indWe can now calculate the p-value of all the tests we need (two tails or one tail).
# Null hypothesis: x.mean() is equal to y.mean()

ttest_ind(x,y)
# Ttest_indResult(statistic=3.4565852447894163, pvalue=0.0008885072426696321)
######################
# Null hypothesis: x.mean() is greater than y.mean()
# (alternative hypothesis: it's less than y.mean())

ttest_ind(x,y,alternative='less')
# Ttest_indResult(statistic=3.4565852447894163, pvalue=0.9995557463786652)
######################
# Null hypothesis: x.mean() is less than y.mean()
# (alternative hypothesis: it's greater than y.mean())

ttest_ind(x,y,alternative='greater')
# Ttest_indResult(statistic=3.4565852447894163, pvalue=0.00044425362133481604)
Comparing the mean values of two samples with different variances
Finally, the most common case: two samples that come from normal distributions with different variances.
Let’s create a new variable that comes from a normal distribution with a standard deviation equal to 5:
z = np.random.normal(size=50,loc=100,scale=5)The function that performs the so-called Welch’s test (i.e. this particular case of Student’s t-test) is “ttest_ind” again, but we have to set the equal_var argument equal to False.
# Null hypothesis: x.mean() is equal to z.mean()

ttest_ind(x,z,equal_var=False)
# Ttest_indResult(statistic=1.094819002420836, pvalue=0.2807390405295771)
######################
# Null hypothesis: x.mean() is greater than z.mean()
# (alternative hypothesis: it's less than z.mean())

ttest_ind(x,z,alternative='less',equal_var=False)
# Ttest_indResult(statistic=1.094819002420836, pvalue=0.8596304797352115)
######################
# Null hypothesis: x.mean() is less than z.mean()
# (alternative hypothesis: it's greater than z.mean())

ttest_ind(x,z,alternative='greater',equal_var=False)
# Ttest_indResult(statistic=1.094819002420836, pvalue=0.14036952026478855)
Conclusions
In this article, I’ve explained 3 types of hypothesis tests based on the mean value: the one-sample t-test, which compares the mean value of a sample with a known expected value, the two-sample t-test with equal variances and the two-sample t-test with different variances (also called Welch’s test). The last two tests compare the mean values of two samples. Although such tests are pretty powerful, it’s always necessary to remember that they strongly require that the samples are generated from gaussian distributions. If this requirement is satisfied, these tests can be performed safely.