Statistics is a data scientist’s best friend. Hypothesis tests are a family of very useful tools for any kind of analysis. They can really help us assess the statistical significance of some phenomena. However, we have to master such tools properly in order to benefit from their advantages.
What is a hypothesis test?
A hypothesis test is a statistical test that assesses a particular hypothesis (called the “null” hypothesis) and calculates confidence about it. For example, if we calculate the height of Mount Everest (which we know to be 8848 meters) and we get 8845 meters, we would like to assess whether the difference between our measure and the known result is statistically significant. That’s the purpose of hypothesis tests. They make us calculate a confidence level and apply it to a particular hypothesis.
Here are the ingredients of a typical hypothesis test:
- The null hypothesis (e.g. our measure of Mount Everest height is statistically equivalent to the known one)
- A statistic value, that is a number calculated by the test and depends on the test type
- A p-value, that is the probability of having as extreme statistics as ours if the null hypothesis is true
- A confidence threshold, which is the minimum value of the p-value we allow not to reject the null hypothesis
The value of the statistics changes according to the type of the test and the p-value calculation changes as well. Usually, the p-value is calculated according to a particular probability distribution, related to the test.
Practically speaking, first of all, state your null hypothesis clearly. It’s a very important and often neglected step. Then, according to your test, calculate the statistics and the p-value. If it’s lower than your allowed threshold, reject the null hypothesis. If it’s greater than or equal to the threshold, you don’t reject the null hypothesis.
Left-tailed, right-tailed and two tails tests
According to the test, you can calculate the p-value using the area of the statistics distribution using one or two tails.
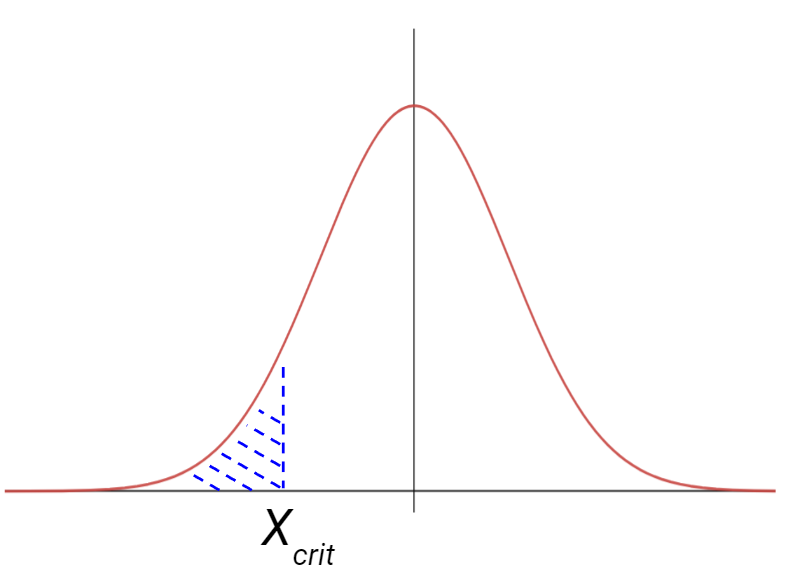
A left-tailed test calculates the p-value as the probability of having a value of the statistics that is lower than the calculated statistics.
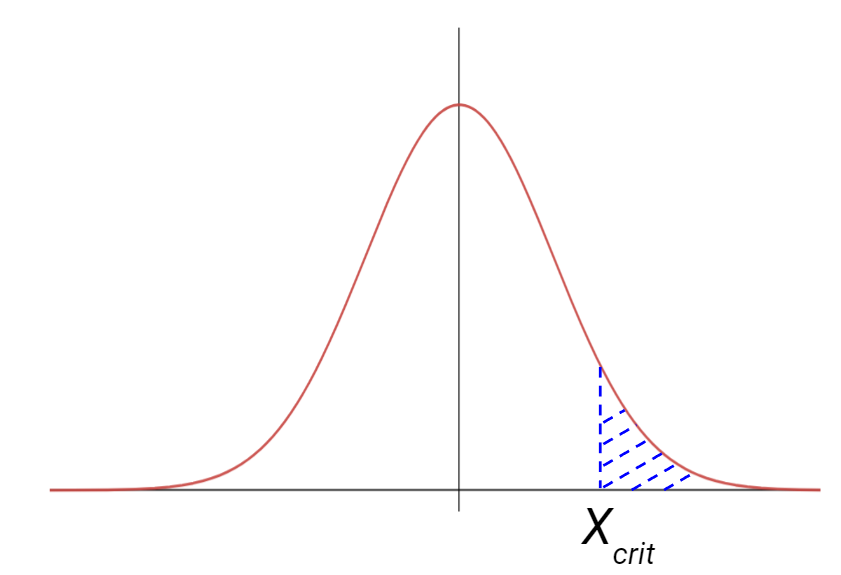
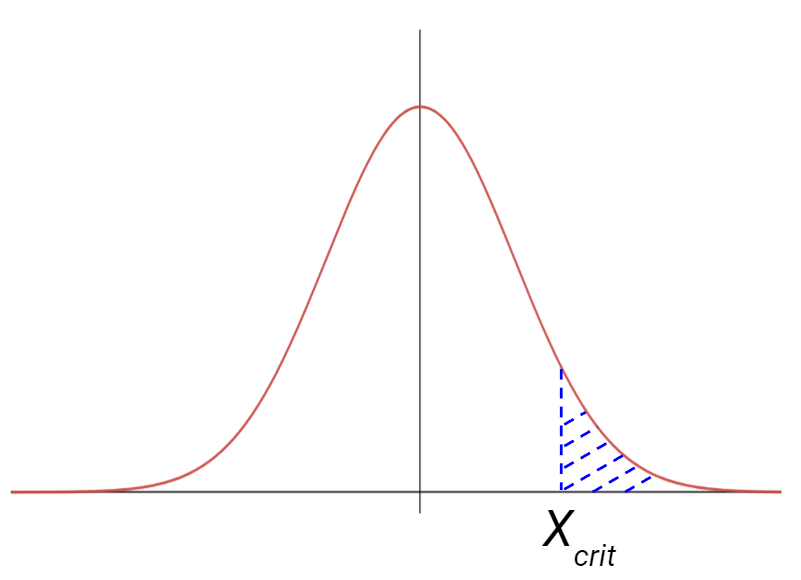
The right-tailed tests, calculate the p-value as the probability of having a value of the statistics that is larger than the calculated one.
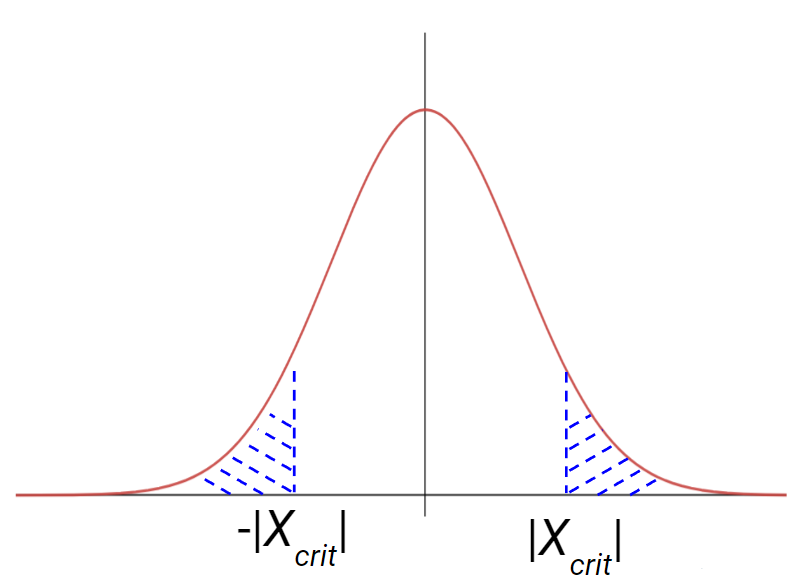
Finally, a two-tailed test considers both situations.
The kind of tail to consider is related to the type of test we want to perform.
How to choose the threshold
A very common threshold for the p-value is 5%. Some industries raise this threshold to 10%, while others lower it to 1% (for example, the health industry). There’s no agreement about it, but 5% has almost become a standard. The idea is that, if the value of our statistics is too extreme, maybe the null hypothesis can be rejected because it’s related to a rare event. If nobody tells you the threshold to use, you can freely apply the 5% threshold.
Common errors
The most common error is to accept the null hypothesis if the p-value is larger than the threshold. Remember: you never accept the null hypothesis. You say that there isn’t any reason to reject it.
Another common error is considering the p-value as the probability that the null hypothesis is true. It’s totally wrong. The p-value is the probability of having a more extreme value of the statistics than the value we have calculated in our test assuming that the null hypothesis is true. So, it’s not the probability that the null hypothesis is true.
Conclusions
Hypothesis tests are very powerful tools for statistical analysis and data science. In the next articles, I’ll talk about some of the most common tests used in data science.