

In binary classification problems, we usually convert the score given by a model into a predicted class applying a threshold. If the score is greater than the threshold, we predict 1, otherwise, we predict 0. This threshold is usually set to 0.5, but is it correct?
The reason behind 0.5
In binary classification, when a model gives us a score instead of the prediction itself, we usually need to convert this score into a prediction applying a threshold. Since the meaning of the score is to give us the perceived probability of having 1 according to our model, it’s obvious to use 0.5 as a threshold. In fact, if the probability of having 1 is greater than having 0, it’s natural to convert the prediction to 1. 0.5 is the natural threshold that ensures that the given probability of having 1 is greater than the probability of having 0. That’s why it’s the default threshold used in Python’s scikit-learn library when we call the predict method of an estimator instance.
So, why may 0.5 not be a good idea? Simply, because it’s an assumption and we, as data scientists, must take decisions driven by data and not by assumptions. Sometimes 0.5 is not the suitable threshold to accomplish our goals. For example, it may not give us high accuracy or may lead to a high value of falses in the confusion matrix. So, the idea is that we have to tune the threshold according to an optimization procedure of some performance metric. The choice of such a metric depends on our problem.
I talk about performance metrics in machine learning in my “Supervised Machine Learning with Python” online course. If you want to go deeper into the several types of metrics you can build, I’m sure that my course will help you.
An example in Python for tuning the threshold
Let’s now see how we can tune the threshold that converts a score into a prediction and let’s do it in Python. You can find the whole work in my GitHub repository.
First, let’s import boston dataset and a logistic regression, plus some metrics like balanced accuracy and the ROC curve.
import numpy as np
import matplotlib.pyplot as plt

from sklearn.datasets import load_boston

from sklearn.linear_model import LogisticRegression
from sklearn.preprocessing import StandardScaler
from sklearn.pipeline import make_pipeline

from sklearn.model_selection import train_test_split,cross_val_score
from sklearn.metrics import roc_curve,plot_roc_curve, balanced_accuracy_score
We can now convert boston dataset into a binary classification problem creating a new target whose values is 1 if the original target value is greater than the mean value, 0 otherwise. Finally, we’ll split the dataset into training and test sets.
X,y = load_boston(return_X_y=True)

y = (y > y.mean()).astype(int)

X_train, X_test, y_train, y_test = train_test_split(X, y, test_size=0.33, random_state=42)
We can create our logistic regression pipeline (with a standard scaler) and fit it.
model = make_pipeline(StandardScaler(),LogisticRegression())

model.fit(X_train,y_train)
Now, let’s see some tuning methods we can use.

Tuning based on ROC curve
Let’s plot the ROC curve calculated in training set.
plot_roc_curve(model,X_train,y_train)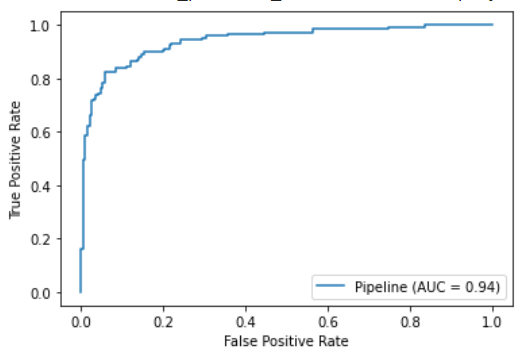
The idea of using the ROC curve for tuning the threshold is to identify that threshold that gives us the upper-left corner of the curve. Mathematically speaking, that threshold p that satisfies the equation:
TPR(p) = 1-FPR(p)
It is equivalent to find the value of p for which the True Positive Rate is equal to the True Negative Rate (which is 1-FPR).
This is a general way of tuning the threshold, often found in academic papers and used by several data scientists.
More generally, we want to find the threshold that satisfies the following:
p^* = \argmin_p |TPR(p)+FPR(p)-1|
This is a very common approach because we convert a root finding problem into an optimization problem.
Practically speaking, we can calculate all the scores generated by our model and find the one that minimizes the argument above.
We can easily calculate all the objects we need using the following code:
fpr, tpr, thresholds = roc_curve(y_train,model.predict_proba(X_train)[:,1],drop_intermediate=False)We can plot the objective function with respect to the threshold and see where its minimum is.
plt.scatter(thresholds,np.abs(fpr+tpr-1))
plt.xlabel("Threshold")
plt.ylabel("|FPR + TPR - 1|")
plt.show()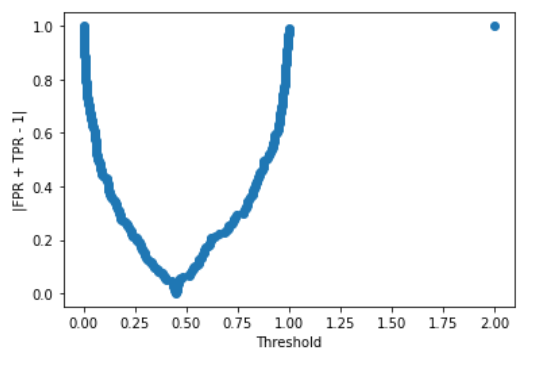
As you can see, we have a minimum slightly before 0.5. The correct value is:
thresholds[np.argmin(np.abs(fpr+tpr-1))]
# 0.44625685602433796
So, this is the threshold we are looking for.
Maximize accuracy
Another approach we can follow is to find the threshold that maximizes the accuracy. For this example, I prefer using balanced accuracy because it takes into account a possible unbalanced dataset.
We first run through all the scores and store the accuracies in a list. Then we plot them.
threshold = []
accuracy = []

for p in np.unique(model.predict_proba(X_train)[:,1]):
  threshold.append(p)
  y_pred = (model.predict_proba(X_train)[:,1] >= p).astype(int)
  accuracy.append(balanced_accuracy_score(y_train,y_pred))
The plot is, then:
plt.scatter(threshold,accuracy)
plt.xlabel("Threshold")
plt.ylabel("Balanced accuracy")
plt.show()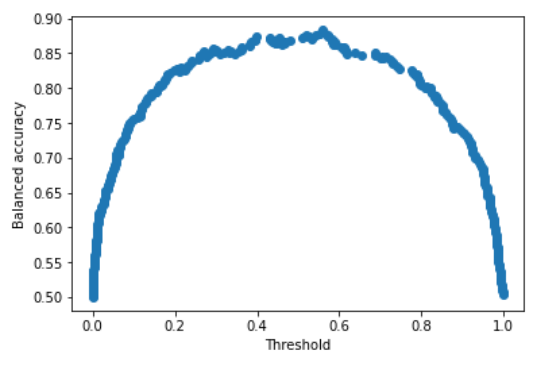
There is a clear maximum between 0.4 and 0.6. Its exact value is:
threshold[np.argmax(accuracy)]
# 0.5602892029098923
Conclusions
In this article, we’ve seen two possible methods to optimize the threshold value of binary classification problems. There are other methods that can be used, but these are two common approaches that can be easily generalized to fit all the needs of a project. Never forget to optimize only on the training dataset and never on the test dataset. Optimizing the threshold is equivalent to optimize a hyperparameter of your pipeline, so we do it only on the training dataset.


Why is there a point in 2.0 in the threshold output?
It’s an artifact of sklearn’s API. It can be ignored.
Thank you. Informative article about how to determine the threshold in a binary classification problem.
Great Article, thank you for writing this, by the way, in cases of one vs rest. You can determine a new sample prediction based on the one vs rest that gives the maximum confidence. Is there a way to bring the idea of threshold into a one vs rest context? You can end up with highest F1-optimal for each class type , but for the aggregate overall metrics preditions you still need to rely on the maximum for prediction threshold. Love to hear your thoughts here. Thanks.
If I have a perfect model with sensitivity = 1 and specificity =1 i.e. no false positive or false negative.
Is there a reason for threshold tuning such a model before deployment ?
e.g. the model could deteriorate hence if it is threshold tuned the performance maybe maintained a lot longer?
Would appreciate sound advice on this one.
Thanks in advance
Elvy
I think thresholds[np.argmin(np.abs(fpr+tpr-1))] is just plain wrong as it minimizes both FPR and TPR