
Outliers are a great problem for a data scientist. They are “strange points” in a dataset that must be checked in order to verify whether they are errors or real phenomena. There are several algorithms that can help us detect outliers, but we sometimes need to measure the probability that a point is an outlier, rather than a 0-1 value. Let’s see a possible method.
What is an outlier?
There are several definitions of what an outlier actually is. Generally speaking, it’s a point too far from the center of the distribution of the dataset it belongs to. These points are actually “strange” and must be checked in advance if we want to feed our model with that dataset. Machine learning models may not always be able to deal with outliers directly and their presence may affect the training dramatically.
That’s why we first need to label a point as an outlier and check later if it must be removed or not.
How to detect an outlier
There are several algorithms that can help us detect outliers. The interquartile range is the most common approach for univariate datasets (it’s used, for example, in the calculation of the boxplots). Multivariate datasets may benefit from Gaussian Envelope or Isolation Forest. Each one of these algorithms applies a label to each point of a dataset, which is 0 if the point is not an outlier and 1 otherwise.
But what happens if we need to know the probability that a point is an outlier? There’s a useful tool we can use for this purpose.
The bootstrap
Who follows my publications knows that I love bootstrap. It’s one of the most useful statistical tools a data scientist can use. It allows us to calculate the precision of a measure and the detection of an outlier is, actually, a measure. So, let’s see one possible use of bootstrap to calculate the probability that a point is an outlier according to a given dataset.
The idea is to resample our dataset and, for each generated sample, check if each point is an outlier. The algorithm you choose is irrelevant, so feel free to use whichever procedure you prefer. Then repeat the procedure again with a new sample generated from the dataset. Some of the original points may not be outliers anymore since the dataset has changed, while other points may have become outliers for the same reason.
Repeat the procedure as many times as you want and calculate, for each one of the original points, the fraction of samples in which it has been labeled as an outlier. This is your probability.
The formal procedure is, then:
- For each point of the dataset, calculate a label that is equal to 0 if the point is not an outlier and 1 otherwise
- Resample the entire dataset with replacement and create a new dataset of the same size
- Repeat procedure 1 and 2 hundreds of times
- Calculate the mean value of the label among the generated samples

An example in Python
Let’s now see how to perform the calculation of the probability of an outlier using Python programming language. For this example, I’ll use the IQR method I talk about in this article.
First of all, let’s import NumPy.
import numpy as npThen, let’s simulate a dataset with 30 pseudo-random numbers generated from a normal distribution.
np.random.seed(0)
x = np.random.normal(size=30)
As we know, the probability of having large numbers (i.e. greater than 3) in a normal distribution is low. Let’s add an artificial outlier, for example, 5.
x = np.append(x,5)The probability that a normal random variable has a value greater than 5 is 0.000000287, so we can say that such a point, if present in a dataset generated from a normal distribution, must raise some suspect. It’s an outlier, then.
Let’s now write a function that, for a given point and array, gives us 1 if the point is an outlier and 0 otherwise.
def check_outlier(value, array):
  q1 = np.quantile(array,0.25)
  q3 = np.quantile(array,0.75)

  iqr = q3-q1

  return int(value > q3+1.5*iqr or value < q1-1.5*iqr)
Let’s apply this function as a map to our original dataset and check the result.
result = np.array(list(map(lambda t: check_outlier(t,x),x))).reshape(1,-1)
As we can see all the points are “good” and the last point has been correctly labeled as an outlier.
Let’s now apply bootstrap to calculate the probability. Let’s remember the steps: resample the dataset, calculate if each point is now an outlier, repeat hundreds of times (500 in this example) and then calculate the fraction of datasets in which our point has been labeled as an outlier.
n  = 500

result = None
for i in range(n):
  new_x = np.random.choice(x,replace=True, size=len(x))
  outliers = np.array(list(map(lambda t: check_outlier(t,new_x),x))).reshape(1,-1)

  if result is None:
    result = outliers
  else:
    result = np.concatenate((result,outliers))
The probabilities can be calculated as the average value of the 0-1 label.
scores = np.apply_along_axis(np.mean,0,result)Let’s now see each point and its score:
np.concatenate((x.reshape(-1,1),scores.reshape(-1,1)),1)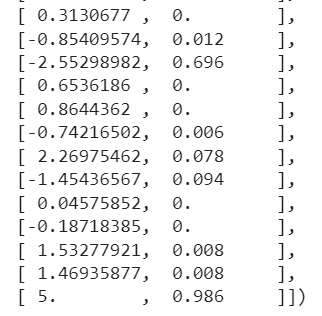
As we can see, -2.55298982 has been considered an outlier with a 69.6% probability. It’s quite realistic because this number is pretty “strange” for a normal distribution, although it’s not “too strange” as 5, which has been considered an outlier with 98.6% probability. So, we can say that these scores actually make sense.
The general idea is to sort our values by score descending. The records with the highest score are most likely outliers.
Conclusion
In this article, I have suggested an algorithm to apply a score to each record of a dataset that represents the probability it is an outlier. The main ingredient of this procedure is the bootstrap technique. This algorithm works with whichever outlier identification technique you use and can be used even for multivariate datasets. Since outlier definition is pretty subjective, I think that calculating a score rather than a 0-1 label may help the data scientist by extracting more information from our data.