Online marketing and startup growth are better if you can continuously test different ideas. The statistic comes into help when we have to perform A/B tests. The results you may achieve with the proper analysis can give your project a great boost.
What is an A/B test?
Companies often need to compare the results of some action with the results of another one in order to identify the most performing one. Generally speaking, there’s often the need to check which is the best solution among a set of possible solutions. For example, if you run a newsletter, you may want to test different subjects for the same e-mail and then select the subject that gives you the highest open rate. That’s the general idea of A/B tests. You split your audience into 2 equal parts: A and C. Then, you split A into 2 subsets of the same size according to the items you want to test (for example, the number of subjects you want to test). You get A and B subsets, then. It’s important that all these sets do not overlap and they must be statistically similar (i.e. there must not be any particular rule that makes the difference between each other).
You then send your e-mail with subject 1 to A and the e-mail with subject 2 to B.
After some time, you measure the performance of A and B. The best performing set will give you the answer of which choice has been successful. You can finally send your e-mail with the winning subject to audience C.
How to compare the results of A/B tests
Let’s say that your A/B test has given these results:
Dataset A
- size: 2128
- openings: 12
Dataset B
- size: 2128
- openings: 18
Dataset B has given more positive events than dataset A, so one could think that B is the winner. In fact, the open rate of A is 0.56% and the open rate of B is 0.85%.
Should we select B? Well, things are not so easy when we work with samples. The Law of large numbers ensures that open rates converge towards their “real” values, but these estimates come from samples, so they suffer from finite-size effects. So, their difference could be due to random effects rather than the real effectiveness of B against A.
We have to perform a statistical analysis in order to solve this problem.
In order to statistically compare these numbers, we first need to calculate their confidence intervals, for example with 95% confidence.
I have already talked about the calculation of confidence intervals on proportions. The general idea is to calculate the confidence interval of our estimate using a normal approximation.
A 95% confidence interval of a proportion p for quite large values of N (typically larger than 30) is:
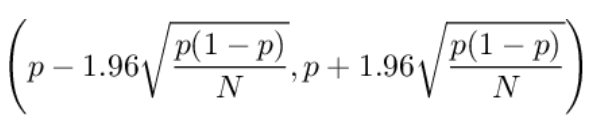
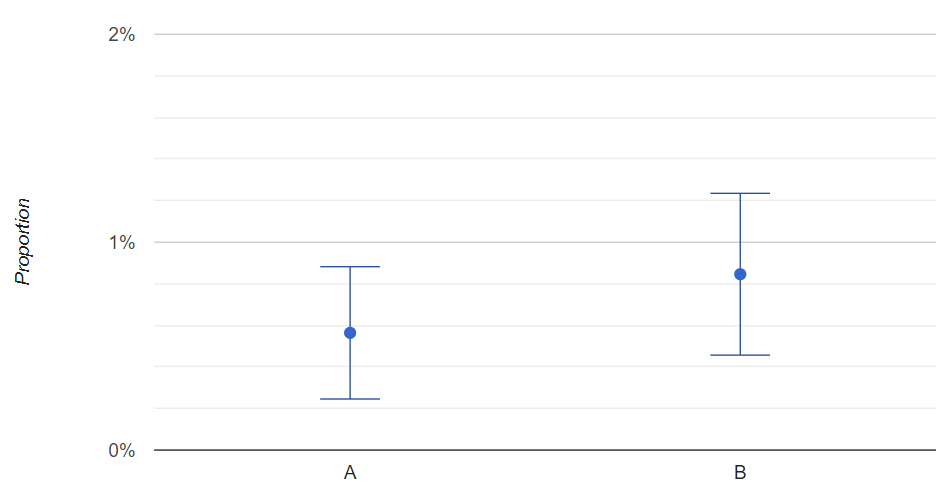
If we perform such calculations on our datasets, we get that the confidence interval for A is (0.25% , 0.88%), while the confidence interval for B is (0.46% , 1.23%).
Let’s plot these intervals to see what happens.
As we can see, although B has a higher mean value than A, the confidence intervals quite overlap with each other. This is a typical finite-size effect due to the fact that our sample is, of course, of finite size.
This plot tells us that the two measures are statistically similar because their confidence intervals overlap. So, we cannot say that B performs better than A.
We could calculate a 2-tailed p-value using a normal approximation in order to have a significance level.
First, we calculate the value of a z variable.
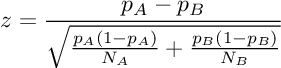
In our case, z = -1.10
Then, we calculate the p-value of a two-sided z test whose null hypothesis is that the proportions are equal. The value we get is 13.6%. So we can say that, if the proportions are equal, we would get such an extreme value of z only in 13.6% of the experiments we would run. If we reject the null hypothesis with a p-value less than 5%, we cannot reject the null hypothesis in this example.
I don’t like the use of p-values, because they can’t give us a clear answer. Instead, I prefer visualizing confidence intervals to see if they do overlap. However, if you work in an environment in which p-values are widely used, you can calculate your p-value using a z test.
A/B test checklist
So, here’s a general approach for your A/B tests:
- Calculate the proportions of A and B
- Calculate the confidence intervals according to the formula
- Visualize them and verify if they overlap. If confidence intervals overlap, you can’t say that the proportions are statistically different. If they don’t overlap, you can say that they are different with 95% confidence
A handy web application
A/B tests can be performed in Python, R, and even Excel. But if you need a quick result and don’t want to develop an application by yourself, I’ve created a simple web app that will calculate the confidence intervals and the p-value for you. Feel free to use it as you want for all your test.
Conclusions
A/B tests are the standard approach to startup growth. They are really able to make a startup scale fast because they validate any possible idea quickly and successfully. However, you always have to use correct statistics behind A/B tests in order to extract the maximum from them.